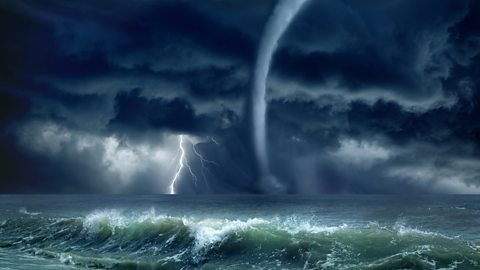
Weather and climate
Weather describes the day-to-day condition of the atmosphere. It might be sunny, hot, windy or cloudy, raining or snowing.
Climate means the average weather conditions in a particular location based on the average weather experienced there over 30 years or more.
The weather takes into account the temperatureThis is a measure of the amount of heat in the atmosphere., precipitationThis is the amount of moisture or water that is in the atmosphere and can be water vapour, rain, sleet, fog, snow or ice., humidityThe amount of water vapour in the atmosphere measured as a percentage. and atmospheric pressureAtmospheric pressure is the weight of air pressing down on us. Air is light but because there is so much of it above us, it exerts a pressure on us. Atmospheric pressure is measured by a barometer. The units used are millibars. of the part of atmosphere (air) closest to the surface of the earth.
The weather is constantly changing as temperature and humidity change in the atmosphere. Landmasses, such as the British Isles, experience constantly changing weather conditions.
Climate refers to what is expected to happen in the atmosphere rather than the actual conditions. It is possible for the weather to be different from that suggested by the climate.
The science of monitoring and studying the atmosphere and predicting its weather and climate is called meteorology. People who study the weather and climate are known as meteorologists.
Measuring the elements of the weather
Weather affects us in many ways. It affects what we do and what we wear, how we travel and even our moods.
meteorologistsPeople who study weather. measure weather conditions in different places and use this information to report and make forecasts about future weather conditions.
This is useful because people can be warned about hazardous weather conditions such as storms and floods.
What do we measure?
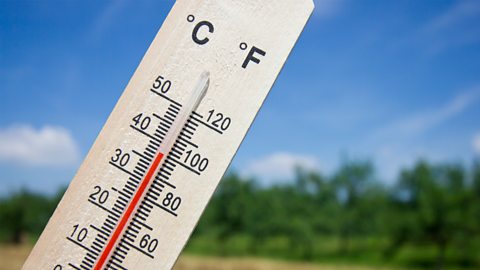
temperatureThis is a measure of the amount of heat in the atmosphere. is measured in Celsius (┬░C) using a digital thermometerThis is a digital device that can be used to measure the temperature of the air around us in degrees Celsius or centigrade..
A digital thermometer has an indoor base station linked to a remote station, that is placed outside but kept in the shade.
The remote station contains a temperature sensitive resistor, called a thermistor and a microcomputer.
A thermistor becomes more conductive when temperature rises and a microcomputer can then use this conductivity to work out the temperature.
The temperature is then transmitted to the base station and displayed on an LCD screen.
The thermometers can be placed in a Stevenson Screen to make sure that the temperature is taken in a shady environment.
This is a wooden box with slatted sides, a sloping roof and legs to keep the screen off the ground. It is painted white to reflect the sun.
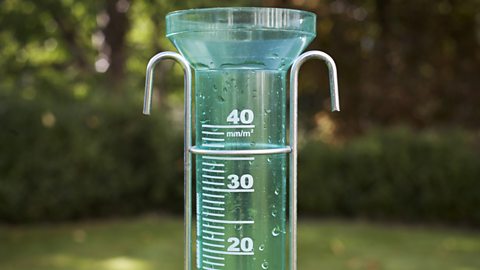
precipitationThis is the amount of moisture or water that is in the atmosphere and can be water vapour, rain, sleet, fog, snow or ice. is measured using a rain gaugeThis is the device that can be used to measure the amount of precipitation in the atmosphere. It usually consists of a funnel that is anchored in the ground and the rainfall is recorded daily in millimetres.. This is made up of three parts; a cylinder, which contains a funnel, to direct the water into a measuring flask, from which you can read the precipitation in millimetres.
The rain gauge is usually anchored in open ground to keep it stable, with the top of the gauge around 30cm above the ground surface to ensure that rain splash does not affect the results.
The depth of the rain in millimetres can be read from the side of the measuring cylinder. The water should then be poured away.
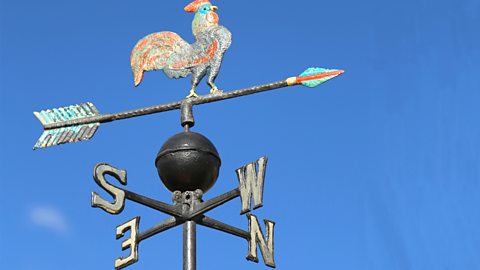
wind directionThis is a measurement of the direction that the wind is blowing from. A compass or a wind vane are usually used to help observe this. is reported by the direction it is blowing from, according to the compass. Wind blowing from the west is travelling eastwards so is called a westerly wind, not an easterly wind. Wind direction is often observed using a wind vaneThis is the device that can be used to help observe the direction that the wind is blowing in. These can usually be found on high buildings and churches..
A wind vane has fixed compass points mounted on a tall pole, above which is an arrow that can rotate in the wind. Wind or weather vanes are placed on top of tall buildings so the wind flow is not interrupted.
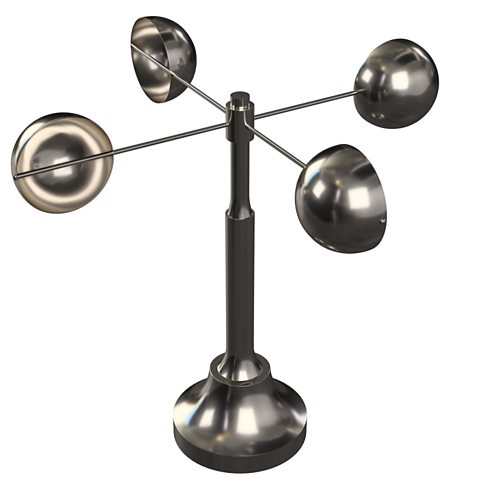
wind speedThis is a measurement of the speed that the wind is moving in. It is usually measured by an anemometer and can be measured in knots or through the use of the beaufort scale. can be measured using an anemometerThis is the device that can be used to measure the speed that the wind is blowing in. A hand held anemometer should be held at armÔÇÖs length, above the head so that the measurement (in knots) can be read.. An anemometer is three or four cups mounted on a pole. As the wind blows, the cups can rotate and each rotation is recorded on a dial which can be easily read.
The anemometer should be held at armÔÇÖs length, above the head so that the cups can rotate without any interference. Or it can be mounted on a tall building. The strength of the wind is measured in knotsThis is the measurement of wind speed. One knot is roughly equivalent to one mile per hour..
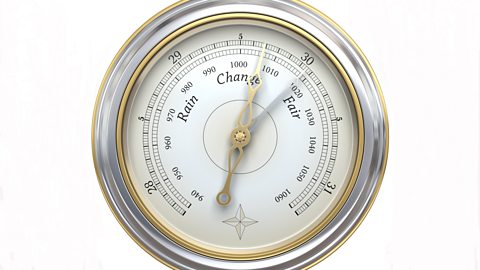
atmospheric pressureAtmospheric pressure is the weight of air pressing down on us. Air is light but because there is so much of it above us, it exerts a pressure on us. Atmospheric pressure is measured by a barometer. The units used are millibars. is the weight of air pressing down on us. Air is light but because there is so much of it above us, it exerts a pressure on us. Atmospheric pressure is measured by a barometerThis is the device that can be used to measure the atmospheric pressure of a place. Usually an aneroid barometer will contain a small vacuum chamber that will expand and contract with the changing air pressure.. The units used are millibarsThis is the measurement of atmospheric pressure. The average (or normal) pressure is 1000 mb and when the pressure goes above this it is classed as high pressure. When the pressure goes below this, it is classes as low pressure..
Aneroid barometers have an airtight metal box inside. When pressure is high this box is squeezed (a bit like a whoopee cushion when you sit on it) and this collapse will trigger a system of pulleys and dials to move the pointer on the face of the barometer. When pressure is low, the box expands and the dial is moved the opposite way.
Normal pressure is 1000mb with a reading above this being regarded as high pressure and a reading below regarded as low pressure. High pressure brings fair weather, low pressure brings rainy weather.
Clouds
Clouds come in many different types. Often the type of cloud can help us to understand what type of weather is moving in across an area.
Clouds are categorised according to height and shape. The different categories of clouds are then given names based on Latin words, e.g. nimbus clouds bring rain, stratus clouds appear as layers.
The main clouds that you need to be aware of are:
Stratus: These are layered clouds that are low, grey and shapeless and usually are like a blanket of cloud over an area. They can bring some drizzle and rain.
Cumulus: These are clouds that move quite quickly. They are white and fluffy and look like cotton wool. They can bring rain showers ÔÇô especially when the base is grey.
Cumulonimbus: These are much deeper clouds that climb high into the atmosphere. They often contain a lot of heavy rain and are associated with thunder and lightning storms.
Cirrus: These are very high clouds that are wispy and made up from ice crystals.
Cloud cover
cloud coverCloud cover is the fraction of cloud covering the sky. is observed (not measured) in units called oktaThis is the measurement for cloud cover. Each okta makes up one eight of the sky and helps us to understand how much of the sky is covered in cloud.. Each okta represents one eighth of the sky covered by cloud.
Sources of data for weather forecast
The weather forecastThis is a broadcast or presentation that attempts to predict the weather that is coming in the next day or further ahead. on TV or on the radio is generated using a massive bank of data that is collected and collated by super-computers.
Data is transmitted globally from 10000 land based stations to meteorological offices daily.
The three main sources of data that are used in weather forecasting are: on land, in the air and at sea.
Land based weather stations and rainfall radar
The UK has a network of 30 major weather observation stations where the weather is recorded continuously to help model the changes that can occur in the atmosphere.
In addition, another 100 coastguard stations and 100 automated stations also provide weather data.
Rainfall radar is used by the Met Office to locate the amount of precipitationThis is the amount of moisture or water that is in the atmosphere and can be water vapour, rain, sleet, fog, snow or ice. in the air.
This uses a type of pulse-Doppler that can indicate where there is precipitation and its direction of movement.
This is made up of a transmitter and receiver. The transmitter sends out microwaves in a circular pattern. Rainfall scatters the microwaves and the receiver detects this and this information can be used to create rainfall radar images.
Weather satellites (geostationary and polar)
Satellites have been used from the 1960s to take images from space of the weather that is happening across the world.
Geostationary satellites stay focused on one spot on the earth and move with the earthÔÇÖs rotation. They usually stay over the equator at an altitudethis is the height in relation to sea level of 36,000km.
Polar-orbiting satellites will move around the earth from one pole to the other at a height of 850km and will pass the same place every 12 hours. During one day, a polar satellite will orbit the Earth 14.1 times.
Instruments used to forecast weather include a scatterometer which uses microwaves to work out the speed and direction of winds, while a radiometer takes colour cloud pictures. Together, these allow forecasts of precipitation.
Weather buoys (at sea)
Weather buoys are usually moored in the ocean and will send live weather and oceanic data back to weather centres for analysis.
These will help show any changes to weather in the atmosphere across a wide area.
Test yourself
More on Weather and climate
Find out more by working through a topic
- count2 of 4
- count3 of 4
- count4 of 4
