Statistical skills
Risk and its impact
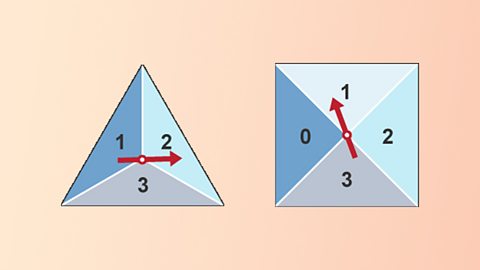
The link between simple probability and expected frequency is explored using a combination of statistics to investigate risk and its impact on life.

Statistical diagrams
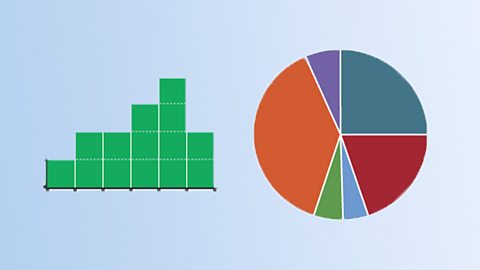
A combination of statistical information can be presented in diagrams. This involves constructing, interpreting and comparing pie charts and cumulative frequency diagrams.

Comparing data sets
Data sets can be compared using averages and measures of spread. A box plot displays information about the range, the median and the quartiles.

Standard deviation
Standard deviation is a measure of the spread of data around the mean value. It is used in comparisons of consistency between different data sets. Two formulae can be used to calculate this.

Video playlist
The Approximate History of Probability. Video
An animated look at probability in maths.

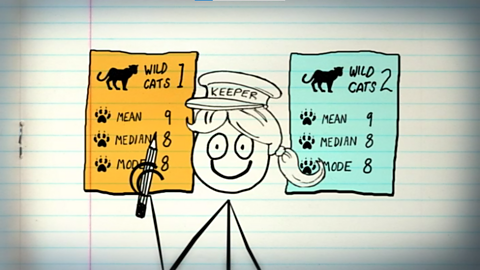
Mean, median and mode. Video
An animated guide to mean, median and mode.

Links
- External linkExternal link
- External linkExternal link
- External linkExternal link
- External linkExternal link