Main content

Predator prey relationships
The fluctuating patterns of predator - prey relationships are illustrated using a graph. The graph builds as the clips progresses through further feeding relationships and food chains.
Duration:
This clip is from

More clips from 28/03/2001
-
![]()
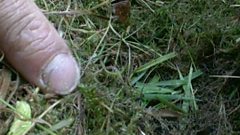
Population decrease factors in barn owls
Duration: 01:30
-
![]()
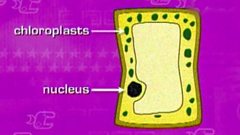
The palisade cell
Duration: 00:33
-
![]()
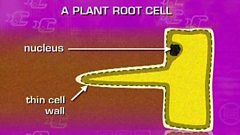
The root hair cell
Duration: 00:27
-
![]()
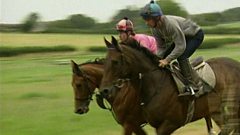
Energy from food
Duration: 01:26
More clips from Key Stage Three Bitesize Revision
-
![]()
BTSZ_HOL_ARTSHOP_2_V2 (1).mov
Duration: 01:25
-
![]()
BTSZ_HOL_ARTSHOP_1_V2.mov
Duration: 00:36
-
![]()
BITESIZE MATHS BASKETBALL PERCENTAGES 2.mov
Duration: 01:16
-
![]()
BITESIZE MATHS BASKETBALL PERCENTAGES 1.mov
Duration: 00:48