Estimate of mean from a grouped table
When data has been grouped, the mean value cannot be found exactly as the individual values in each class are not known.
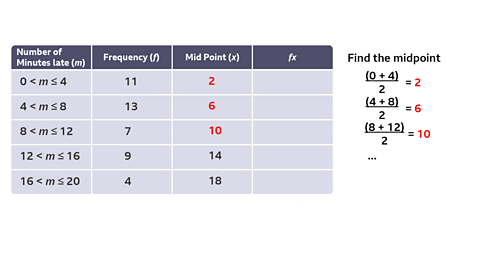
To find an approximate value for the mean from a grouped frequency table, the value of the midpoint of each class interval is used to represent all the values in the class.
For example, if the interval is 5 ≤ d < 10, it is assumed that all the values in that class have the value 7.5.
It might be helpful to look at M1 mean/median/mode/range
Example
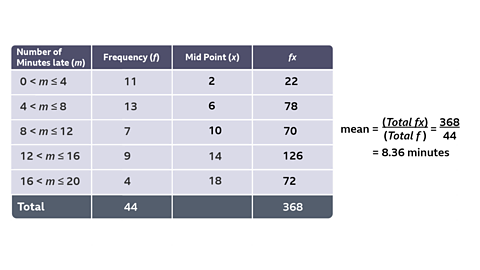
A railway supervisor records the number of trains arriving late at the station and the number of minutes each one was late by.
| Number of Minutes late (m) | Frequency (f) |
|---|---|
| 0 < m ≤ 4 | 11 |
| 4 < m ≤ 8 | 13 |
| 8 < m ≤ 12 | 7 |
| 12 < m ≤ 16 | 9 |
| 16 < m ≤ 20 | 4 |
Estimate the mean number of minutes late.
Remember that an estimate in this context does not mean that the numbers given should be rounded.
Solution
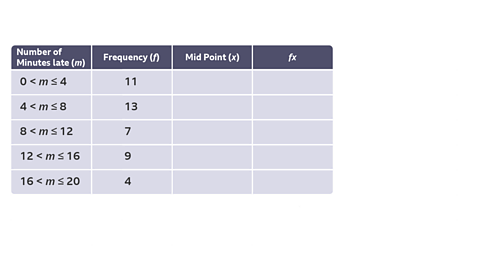
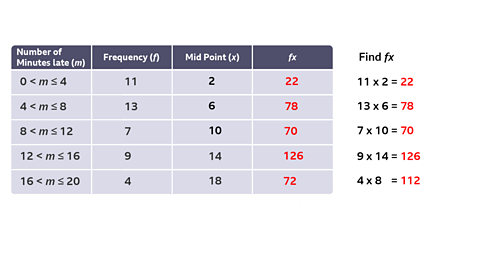
Image caption, Add two extra columns with headings 'Mid-Point (x)' and 'fx'.
1 of 5
Question
The table shows how much (to the nearest ВЈ) 100 customers leaving a supermarket had spent on their shopping.
| Number of Minutes late (m) | Frequency (f) | 'Mid-interval value (x)' | (fx) |
|---|---|---|---|
| 0 < m ≤ 20 | 10 | ||
| 20 < m ≤ 40 | 16 | ||
| 40 < m ≤ 60 | 26 | ||
| 60 < m ≤ 80 | 22 | ||
| 80 < m ≤ 100 | 13 | ||
| 100 < m ≤ 120 | 10 | ||
| 120 < m ≤ 140 | 3 |
By completing the last two columns, find an estimate for the mean amount spent.
Solution
| Number of Minutes late (m) | Frequency (f) | 'Mid-interval value (x)' | (fx) |
|---|---|---|---|
| 0 < m ≤ 20 | 10 | 10 | 100 |
| 20 < m ≤ 40 | 16 | 30 | 480 |
| 40 < m ≤ 60 | 26 | 50 | 1300 |
| 60 < m ≤ 80 | 22 | 70 | 1540 |
| 80 < m ≤ 100 | 13 | 90 | 1170 |
| 100 < m ≤ 120 | 10 | 110 | 1100 |
| 120 < m ≤ 140 | 3 | 130 | 390 |
| Total | 100 | 6080 |
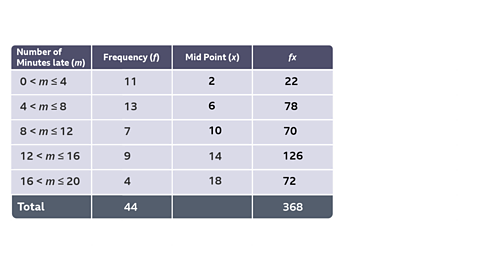
\(\text{mean} = \frac{total fx}{total f} = \frac{6080}{100} = 60.8\)
Answer:
ВЈ60.80
Median from grouped table
The median value cannot be found from a grouped table but the group containing the median value can be identified.
Example
Frequency table
| Amount Spent (p) nearest ВЈ | Frequency (f) |
|---|---|
| 1 ≤ p ≤ 20 | 10 |
| 21 ≤ p ≤ 40 | 16 |
| 41 ≤ p ≤ 60 | 26 |
| 61 ≤ p ≤ 80 | 22 |
| 81 ≤ p ≤ 100 | 13 |
| 101 ≤ p ≤ 120 | 10 |
| 121 ≤ p ≤ 140 | 3 |
| Total | 100 |
Identify the class interval in which the median lies.
Solution
There are 100 values. The median value is the mean of the 50th and 51st values.
| Amount Spent (p) nearest ВЈ | Frequency (f) | |
|---|---|---|
| 1 < p ≤ 20 | The first 10 values line in this group | 10 |
| 21 < p ≤ 40 | Values 11 to 26 lie in this group | 16 |
| 41 < p ≤ 60 | Values 27 to 52 lie in this group | 26 |
| 61 < p ≤ 80 | 22 | |
| 81 < p ≤ 100 | 13 | |
| 101 < p ≤ 120 | 10 | |
| 121 < p ≤ 140 | 3 | |
| Total | 100 |
Both the 50th and 51st values lie in the class interval 41 ≤ p ≤ 60
Answer:
The class interval in which the median lies is 41 ≤ p ≤ 60
Modal Class from grouped table
The modal value cannot be found from a grouped table, but the modal class can be identified.
The modal class is the class interval with the highest frequency.
Example
Frequency table
| Amount Spent (p) nearest ВЈ | Frequency (f) |
|---|---|
| 1 ≤ p ≤ 20 | 10 |
| 21 ≤ p ≤ 40 | 16 |
| 41 ≤ p ≤ 60 | 26 |
| 61 ≤ p ≤ 80 | 22 |
| 81 ≤ p ≤ 100 | 13 |
| 101 ≤ p ≤ 120 | 10 |
| 121 ≤ p ≤ 140 | 3 |
| Total | 100 |
Identify the modal class interval.
Solution
The highest frequency is 26 and the class interval with this frequency is 41 ≤ p ≤ 60.
Answer:
The modal class interval is 41 < p ≤ 60