Main content

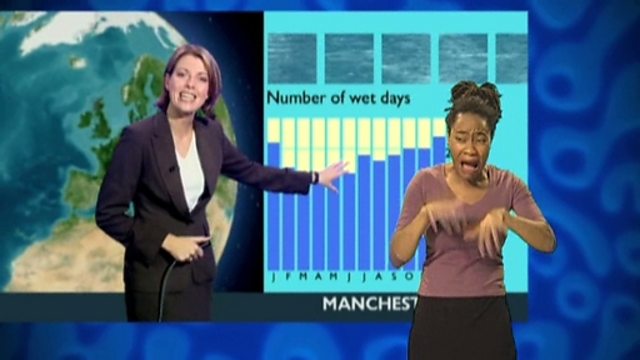
Bar charts - analysing weather data (signed)
An introduction to a real life situation in which bar charts are useful, analysing the weather in terms of hours of sunshine and rainfall amounts. The school holiday period is used as the focus to give the data more meaning. A problem is posed for the children to answer, with thinking time allowed before the answer is given.
Duration:
This clip is from
More clips from Year 5 - Data Handling
-
![]()
Bar charts - analysing weather data (signed)
Duration: 03:02
-
![]()
How to interpret a bar chart (signed)
Duration: 01:30
-
![]()
Finding the modal number (signed)
Duration: 01:42
-
![]()
How to interpret a bar chart
Duration: 01:27
More clips from The Maths Channel
-
![]()
Measurement of weight (signed)—Year 5 - Area
Duration: 00:50
-
![]()
Division with remainders (signed)—Year 4 - Division
Duration: 02:23
-
![]()
Measuring weight - grams and kilograms (signed)—Ordering Numbers
Duration: 02:33


