The editorial coverage of news events can often be challenging. Newsrooms are always under pressure to provide coverage that offers a sense of being present at an event. In doing so, journalists need to identify and summarise interesting stories, and to illustrate them with visual elements.
Thanks to the widespread use of mobile devices, many people want to share their videos and images publicly. This type of content captured by audiences or non-professionals is commonly known as User Generated Content (UGC). UGC often provides unique personal perspectives and snapshots of events that professional broadcasters may not be able to capture and so it can be ideal for supporting the creation and automated illustration of news events. However, journalists usually receive this kind of footage in a mostly unorganised and unstructured way, often as different types of media files - which are difficult to navigate and preview in a large quantity.
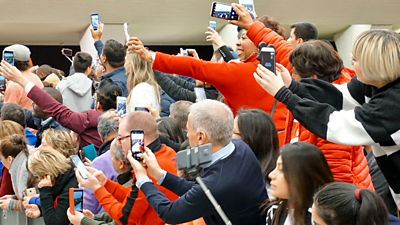
For instance, our illustration below shows several video clips filmed at a cycle race by the public. These show cyclists at several non-sequential points in the competition. In this example, the editor would need to manually trawl through all the potential images, select the relevant ones, and then manually organise them into a coherent storyline for viewers.

To speed up this process and allow the narrative of the story to be built automatically using UGC, we need to address two main challenges:
- Finding the right content for each news story;
- Creating a coherent narrative that illustrates each part of the news story using the most appropriate and relevant visual elements. In itself, this is a complicated task.
To explore how all this might be possible and to look for answers, we collaborated with the NOVA University of Lisbon to create a reference point to compare and evaluate against automatically generated stories.
SocialStories: Finding the right content
To do this, we set out to capture some source material which would allow us to define a benchmark, for storylines that are automatically compiled. Our goal was to capture text and images, or text and video that would be suitable to tell the story of our test events - the Edinburgh Festival (an annual international celebration of performing arts), and the Tour de France cycling race. Forty stories were produced at these events, which helped us create our SocialStories benchmark. This has allowed us to develop an evaluative test for UGC content that is to be selected, and for the narrative structure of automatically generated stories.
You can read our research paper '' in the proceedings of the 2019 International Conference on Multimedia Retrieval (ICMR '19). .
Storyline Quality Metric: Creating a coherent narrative
Journalists are continually monitoring the quality of material to decide if it is newsworthy. The task of finding footage that is suitable to illustrate a story depends on a variety of things. While an editor's subjective preference plays a part in this process (which cannot be replicated by automation), other quantitative factors are also important.
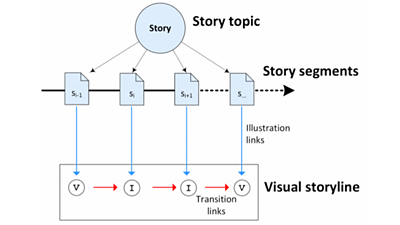
We have designed and proposed a quantitative metric to automatically evaluate the quality of a story by assessing its objective characteristics. In particular, we used the relevance of videos or images (shown in blue in the diagram below) and coherence of transitions - the change from one visual element to the next (shown in red). These were manually annotated for all story segments in the dataset.

Both of these have been combined into one value which relates to the quality of the visual storyline. A metric like this gives us a simple, consistent way of evaluating any story, which we validated by conducting some crowd-sourced subjective experiments. We found that there is a very strong relationship between a subjective evaluation of the quality of an automatically generated story and our objective quality metric.
Where are we using this?
Creating a benchmark for not only the quality of material but also the narrative structure of a story is extremely important for anyone designing automated visual storytelling tools. Our research means we are now able to understand the quality of a visual storyline better. Understanding this can, therefore, help us design new technology to support or automate some of the tasks in covering news events.
We have used a benchmark in the development of the COGNITUS system, which can help broadcasters cover large events, and capture more personalised views of such events with the use of UGC. A mobile app allows event attendees to uploaded video to the COGNITUS platform - which can gather footage from many different users and automatically create narratives and stories from the event. Production teams can quickly summarise stories they are interested in covering from large numbers of contributors on location.
- The SocialStories benchmark was created in collaboration with David Semedo and Jo茫o Magalh茫es at


