Key points
- Examples of waves include: light, sound, ocean waves, radio waves, ultraviolet radiation and more.
- All waves transfer energy from one place to another.
- There are two types of wave: A wave in which the particles move up and down at right angles to the direction it travels in, like an ocean wave or lifting a rope up and down. or A wave where the particles move forwards and backwards in the direction that the wave travels. For example sound waves and the movement you get if you moved a metal spring forwards and backwards..
- Waves can be represented using diagrams, which allow their Frequency is the number vibrations of the wave in one second, also seen as the number of complete waves passing a point in one second. Frequency is measured in hertz (Hz)., The distance covered by a full cycle of the wave. Usually measured from peak to peak, or trough to trough. and The height of the top of a wave from its resting position. The greater the amplitude, the taller the wave (and the louder the sound if a sound wave). to be compared.
Types of wave
Waves transfer energy from one place to another. Light from the Sun travels through space and through the atmosphere, transferring energy to the Earth and other planets.
Sound travels from a loudspeaker and transfers energy to the objects which absorb it for example, your ears.
Some waves move through a substance because the particles vibrate at right angles to the direction that the wave is moving in, these types of waves are called transverse waves.
Other waves travel because the particles move backwards and forwards a short distance in the same direction as the wave is moving in. These types of waves are called longitudinal waves.
Watch the GB surfing team demonstrate the different types of wave
Transverse waves
The following types of waves are transverse waves:
- ocean waves
- light waves
- microwaves
- radio waves
- ultraviolet radiation
Transverse waves can also be made by shaking a rope up and down or from side to side and look like this:

Image caption, 1. A hand holds a length of rope taut
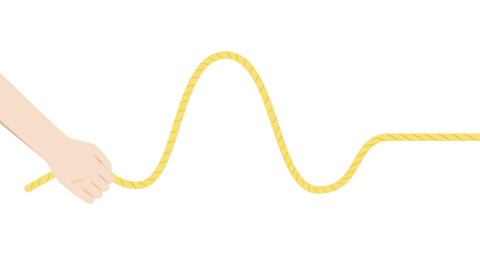

1 of 3
In the diagram above the rope moves up and down but the energy is transferred along the rope from left to right, at 90┬░ to the oscillation.
In a transverse wave, the A wave oscillates, which means it moves backwards and forwards or up and down in a regular, repeating way. (vibration) is at right angles to the direction of energy transfer.
- The particles move up and down as the wave moves from left to right.
- However, none of the particles are transported along a transverse wave.
Longitudinal waves
Sound waves, pressure waves and primary waves ( a type of seismic wave produced by earthquakes), are longitudinal waves. Longitudinal waves can also be made by pushing a slinky forwards and backwards, and they look like this:
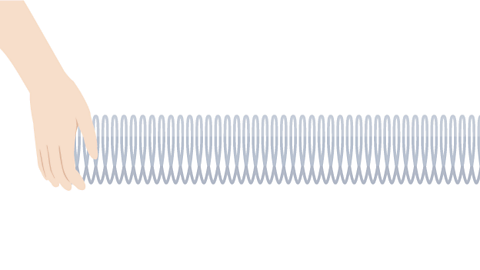
Image caption, The hand on the coiled metal spring creates the movement of the vibration
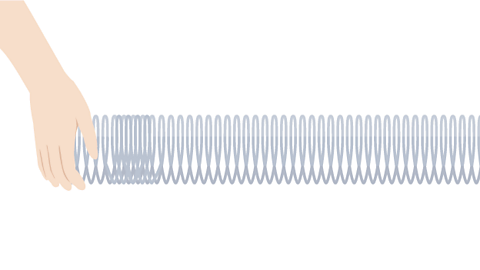
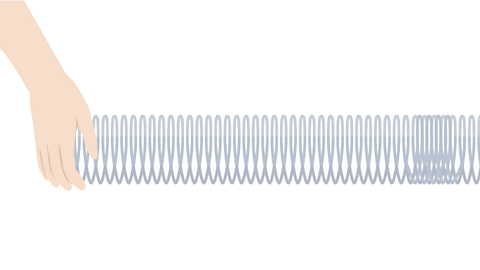
1 of 3
In a longitudinal wave, the vibration is parallel to the direction of energy transfer.
In the diagram above, each individual coil of the slinky moves backwards and forwards either side of its rest position. However, none of the coils are moved along the length of the slinky. They just move backwards and forwards parallel to the direction in which the energy flows. The energy is transferred along the slinky, parallel to the oscillation.
Describing transverse waves
There are some important terms which are used to describe waves:
Peak ÔÇô the highest point of a transverse wave is called a peak, like the highest point of a mountain.
Trough ÔÇô the lowest point of a transverse wave is called a trough because it makes the shape of a trough that an animal might eat from.
Amplitude ÔÇô the distance from a peak or a trough, to the rest position is called the amplitude of the wave. A wave with tall peaks has a large amplitude.
Wavelength ÔÇô The distance from one peak to the next peak is called the wavelength. The wavelength of a wave could also be measured from one trough to the next trough, or from any point on the wave to the same point on the next cycle of the wave.
Frequency ÔÇô the number of complete vibrations in one second. This is the same as the number of complete waves passing a point each second. Frequency is measured in hertz (Hz). A frequency of 50 Hz means there are 50 vibrations every second, or that 50 waves pass by every second.
Time period ÔÇô the time taken for one complete cycle of the wave. It is also the time taken for one complete wave to pass by, for example the time from one peak to pass until the next or from one trough to pass by until the next.
Describing longitudinal waves
The same terms can be used to describe longitudinal waves, but with a few important differences:
Compression ÔÇô a region of high pressure, where the particles are closer together than normal.
Rarefaction ÔÇô a region of low pressure, where the particles are further apart than normal.
Amplitude ÔÇô the maximum distance a particle moves from its rest position.
Wavelength ÔÇô The distance from the centre of one compression to the centre of the next compression is called the wavelength. The wavelength of a longitudinal wave could also be measured from the centre of a rarefaction to the centre of the next rarefaction.
Frequency ÔÇô the number of vibrations in one second. This is the same as the number of complete waves passing a point each second. Frequency is measured in hertz (Hz). A frequency of 50 Hz means there are 50 vibrations every second, or that 50 waves pass by every second.
Time period ÔÇô the time taken for one complete cycle of the wave. It is also the time taken for one complete wave to pass by, for example the time from one compression to pass until the next.
Comparing wave diagrams
Displacement-distance graphs
Displacement-distance graphs are diagrams that can be used to compare the amplitude and wavelength of different waves. Displacement-distance graphs can be used to measure and compare the wavelength of a wave in units. The distance from peak to peak, or trough to trough, is the wavelength.
Displacement-time graphs
Displacement-time graph demonstrate how the displacement of one point on the wave varies over time. A displacement-time graph can be used to compare the number of waves in a particular time period, which in turn can be used to compare the frequency of different waves.
Test your knowledge
Play the Atomic Labs game! game
Try out practical experiments in this KS3 science game.

More on Waves
Find out more by working through a topic
- count2 of 15

- count3 of 15

- count4 of 15

- count5 of 15