Speed, distance and time
Distance is how far an object moves or how far apart two positions are.
Speed is the The amount of change in the size of a quantity each second. of distance - it is the distance travelled per unit time.
The velocity of an object is its speed in a particular direction.
Video: An introduction to the speed equation
In this short video Professor Brian Cox gives an introduction to speed. He defines what is meant by speed and how to calculate speed by applying the 'distance divided by time' equation.
Calculations involving speed, distance and time
The speed of an object can be calculated using the equation:
\(average\) \(speed = \frac{total~distance~travelled}{total~time~taken}\)
\(v = \frac{s}{t}\)
This is when:
average speed (v) is measured in metres per second (m / s)
total distance travelled (s) is measured in metres (m)
total time taken (t) is measured in seconds (s)
Example
A car travels 500 m in 50 s, then 1500 m in 75 s. Calculate its average speed for the whole journey.
First calculate total distance travelled (s):
500 + 1500 = 2000 m
Then calculate total time taken (t):
50 + 75 = 125 s
Then use:
\(v = \frac{s}{t}\)
\(v = 2000 \div 125\)
\(v = 16~m/s\)
Extended syllabus content: Defining acceleration
If you are studying the Extended syllabus, you will also need to define acceleration and use the relevant equation. Click 'show more' for this content:
The rate of change in speed (or velocity) is measured in metres per second squared. Acceleration = change of velocity ├À time taken. is the rate of change of velocity. It is the amount that velocity changes per unit time.
The change in velocity can be calculated using the equation:
change in velocity = final velocity - initial velocity
\(\Delta v = v - u\)
The average acceleration of an object can be calculated using the equation:
\(acceleration = \frac{change~in~velocity}{time~taken}\)
\(a = \frac{\Delta v}{\Delta t}\)
This is when:
acceleration (╬▒) is measured in metres per second squared (m/s┬▓)
change in velocity (Ôêåv) is measured in metres per second (m/s)
change in time taken (Ôêåt) is measured in seconds (s)
If an object is slowing down, it is decelerating (and its acceleration has a negative value).
Example
A car takes 8.0 s to accelerate from rest to 28 m/s. Calculate the average acceleration of the car.
final velocity, v = 28 m/s
initial velocity, u = 0 m/s (because it was at rest - not moving)
change in velocity, Ôêåv = (28 - 0) = 28 m/s
\(a = \frac{\Delta v}{\Delta t}\)
\(a = 28 \div 8\)
\(a = 3.5 m/s^2\)
Podcast: Displacement, distance and speed
This episode gives an introduction to displacement, distance and speed, including their differences and how to calculate them.
JAMES: Hello and welcome to the ┤¾¤¾┤½├¢ Bitesize Physics podcast.
ELLIE: The series designed to help you tackle your GCSE in Physics and combined science.
JAMES: IÔÇÖm James Stewart, IÔÇÖm a climate science expert and TV presenter.
ELLIE: And IÔÇÖm Ellie Hurer, a bioscience PhD researcher.
JAMES: Today we're going to be talking about displacement, distance and speed. Shall we?
ELLIE: Let's begin. So, James, do you remember how we talked about scalar and vector quantities in episode one?
JAMES: Oh yeah, I do. Scalar quantities just have a magnitude, whereas vector quantities have a magnitude and a direction.
ELLIE: And we can apply that to today's topics too, as we talk about distance, displacement, speed and velocity.
JAMES: Yeah, let's start off with some definitions. We love a definition. So distance is how far an object moves, for example, getting into a car and driving 10 miles.
Distance is a scalar quantity because it only includes magnitude. In this case, that's miles.
ELLIE: Right, and a similar but different term is displacement.
Displacement is a vector quantity. Displacement includes both the distance an object moves, say 10 miles again, but also the direction, for example, north. And when we measure displacement, we measure it from the start point to the finish point in the direction of a straight line.
JAMES: So if we were describing the displacement of a car, we'd say something like, I drove the car ten miles north. Which, you're right, makes it a vector quantity because of measuring both distance and direction.
ELLIE: Okay, yep, that makes sense. Distance is just distance, and displacement is both distance and direction.
JAMES: But a moving object can have a different value for its distance and its displacement.
For example, a car going along a winding road might travel a distance of half a mile. But have a displacement of a quarter of a mile to the east. Now that could be because the displacement is measured as a straight line from the start to the end point.
ELLIE: Another interesting example is someone running around a 400 metre track. They would have a distance of 400 metres, but a displacement of zero.
So, for the next topic, we need to head to the racing track, because we're going to explore speed.
JAMES: Can you hear how quickly those cars are going in here? It's like being trackside at the Formula 1.
ELLIE: It is! Did you know that the fastest recorded Formula One car drove at just over 397 kilometres per hour.
JAMES: So you're probably already familiar with speed. It's how fast or slowly an object moves. Speed is a scalar quantity because we only measure magnitude. And if you want a quick way to remember that, speed and scalar, well they both start with an ÔÇÿsÔÇÖ.
ELLIE: But how do we calculate speed? Well, grab your pen and paper, because you're going to want to write this down. Right, let's start with the equation. Distance equals speed multiplied by time taken. But you can rearrange that equation to calculate speed.
So speed equals distance divided by time taken. Distance is measured in metres, time is measured in seconds, and speed is measured in metres per second.
JAMES: So let's look at that as a practical example. Again, grab your pen and paper if you want to write this out, and follow along with the calculation.
So let's imagine a race car drives 100 metres in the space of 10 seconds. Speed equals distance divided by time taken. So the answer to the calculation would be that the race car drives at a speed of 10 metres per second.
ELLIE: So let's flip that equation around to measure distance, too. If you're measuring the distance travelled by a moving object in a specific time, distance travelled equals speed multiplied by time.
JAMES: Okay, now it's your turn to try and work it out. I'm gonna give you an example. So if a car travelled at a speed of 15 metres per second, and it travelled for 20 seconds, how would you calculate its distance? We'll give you a few moments to work that one out.
Using that equation, we could calculate its distance by writing out that 15 metres per second multiplied by 20 seconds equals a distance of 300 metres.
ELLIE: Well done, James.
JAMES: Thank you.
ELLIE: So, let's maybe rewind that equation and make sure you have it down. If you're measuring the distance travelled by a moving object in a specific time, distance travelled equals speed multiplied by time.
JAMES: By the way, good time to mention the standard units of measurement, you know how important that is in physics, in these equations are metres, seconds, and metres per second. However, some questions might use different units, so whatever's being used in the question, best to use that in the answer.
ELLIE: Let's say, for example, if the question asked you to calculate the speed of a race car that drove 100 kilometres over the course of 10 minutes, you would identify the time is in minutes, and the distance is in kilometres, therefore the speed would be measured in kilometres per minute instead.
But in the exam, if you're asked to give your answer in a particular unit, then you might have to convert that answer, for example from minutes to seconds.
JAMES: Okay, now we've learned about speed, how about velocity?
ELLIE: Well, well, well. Velocity is the speed of an object in a given direction. For example, a race car driving 80 miles per hour south.
Because we're measuring both speed and direction, velocity is a vector quantity. To memorise that, just remember that vector and velocity both start with a ÔÇÿVÔÇÖ.
JAMES: Although speed and velocity are different things, they are calculated using the same equation. So instead of saying that speed equals distance divided by time, you would say that velocity equals displacement divided by time.
ELLIE: But the key difference to know when you're doing that calculation is that when you calculate velocity, you must also include a direction in your answer. So you can't just say that a race car is driving at a hundred and fifty miles per hour. You would say that race car is driving at one hundred and fifty miles per hour east.
JAMES: Before we go, let me give you a quick recap of what we've learned today then. So firstly, speed and distance are scalar quantities. Because we just measure their magnitude.
Secondly, displacement and velocity are vector quantities, because we measure both magnitude and direction. Remember, v and v.
And finally, the equation to calculate distance travelled is distance travelled equals speed multiplied by time.
ELLIE: Fabulous.
So that's all you need to know for now about displacement, distance and speed. But be sure to listen to the next episode where we're going back to the racetrack to learn the essentials of velocity and acceleration.
JAMES: Oh yes, back to the racetrack, finally. Thank you for listening to Bitesize Physics. If you found this helpful, please do go back and listen again, make some notes and come back here as many times as you want to help you revise.
ELLIE: There's also lots more resources available on the ┤¾¤¾┤½├¢ Bitesize website, so be sure to check that out.
BOTH: Bye!
Distance-time graphs
If an object moves along a straight line, the distance travelled can be represented by a distance-time graph.
Key fact: in a distance-time graph, the gradient of the line is equal to the speed of the object. The greater the gradient (and the steeper the line) the faster the object is moving.
Example
Calculate the speed of the object represented by the green line in the graph, from 0 to 4 s.
change in distance = (8 - 0) = 8 m
change in time = (4 - 0) = 4 s
\(speed = \frac{distance}{time}\)
\(speed = 8 \div 4\)
\(speed = 2~m/s\)
Question
Calculate the speed of the object represented by the purple line in the graph.
change in distance = (10 - 0) = 10 m
change in time = (2 - 0) = 2 s
\(speed = \frac{distance}{time}\)
\(speed = 10 \div 2\)
\(speed = 5~m/s\)
Distance-time graphs for accelerating objects
If the speed of an object changes, it will be accelerating or Slowing down or negative acceleration, eg the car slowed down with a deceleration of 2 msÔü╗┬▓.. This can be shown as a curved line on a distance-time graph.
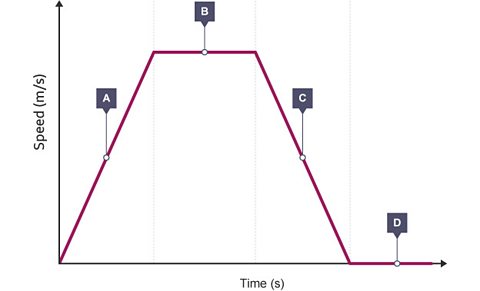
The table shows what each section of the graph represents:
| Section of graph | Gradient | Speed |
|---|---|---|
| A | Increasing | Increasing |
| B | Constant | Constant |
| C | Decreasing | Decreasing |
| D | Zero | Stationary (at rest) |
If an object is accelerating or decelerating, its speed can be calculated at any particular time by:
drawing a A straight line that just touches a point on a curve. A tangent to a circle is perpendicular to the radius which meets the tangent. to the curve at that time
measuring the gradient of the tangent
Speed-time graphs
Speed-time graphs are useful when describing the movement of an object.
We can use them to determine whether or not the object is moving at any point in time. We can also use them to see what speed the object is travelling at that point in time.
Using data from the graph, we can calculate any The rate of change in speed (or velocity) is measured in metres per second squared. Acceleration = change of velocity ├À time taken., the change in speed and the change in time.
We can also use graphs to calculate distance travelled. The area under a speed-time graph represents the distance travelled.
Extended syllabus content: Speed-time graphs for accelerating objects
If you are studying the Extended syllabus, you will also need to know about speed-time graphs for accelerating objects. Click 'show more' for this content:
Determining acceleration
A sloping line on a speed-time graph represents an acceleration. The sloping line shows that the speed of the object is changing. The object is either speeding up or slowing down.
The table shows what each section of the graph represents:
| Section of graph | Gradient | Speed | Acceleration |
|---|---|---|---|
| A | Positive | Increasing | Positive |
| B | Zero | Constant | Zero |
| C | Negative | Decreasing | Negative |
| D | Zero | Stationary (at rest) | Zero |
Calculating the area under a speed-time graph
The distance of an object can be calculated from the area under a speed-time graph.
The area under the graph can be calculated by:
using geometry (if the lines are straight)
counting the squares beneath the line (particularly if the lines are curved)
Example
Calculate the total distance of the object, whose motion is represented by the speed-time graph below.
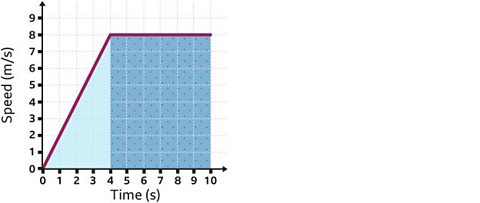
Here, the distance can be found by calculating the total area of the shaded sections below the line.
Find the area of the triangle:
\(\frac{1}{2} \times base \times height\)
\(\frac{1}{2} \times 4 \times 8 = 16\)
The area of the triangle is 16 m2
Find the area of the rectangle:
base × height
(10 - 4) × 8 = 48
The area of the rectangle is 48 m2
Add the areas together to find the total distance:
(16 + 48) = 64
Total distance = 64 m
Free fall
Near the surface of the Earth, any object falling freely will have an acceleration of about 9.8 metres per second squared (m/s2).
Extended syllabus content: The motion of objects falling
If you are studying the Extended syllabus, you will also need to be able to describe the motion of objects falling. Click 'show more' for this content:
Objects falling through a A substance that can flow, such as a liquid or a gas. eventually reach The maximum speed of an object, reached when the forces moving the object are balanced by its frictional forces.. At terminal velocity, the object moves at a steady speed in a constant direction because the The single force that could replace all the forces acting on an object, found by adding these together. If all the forces are balanced, the resultant force is zero. acting on it is zero.
Three stages of falling
At the start, the object accelerates downwards due to the force of gravity.
As the object's speed increases, frictional forces such as air resistance or drag increase.
At terminal velocity, the weight of the object due to gravity is balanced by the frictional forces and the resultant force is zero.
The weight of an object does not change as it falls, as long as it stays whole.
A skydiver
The diagram shows what happens to the speed of a skydiver from when they leave the aircraft, to when they reach the ground after their parachute opens.
Before the parachute opens:
Immediately on leaving the aircraft, the skydiver accelerates downwards due to the force of gravity. There is little air resistance acting in the upwards direction, and there is a resultant force acting downwards. The skydiver accelerates towards the ground.
As the skydiver gains speed, their weight stays the same but the air resistance increases. There is still a resultant force acting downwards, but this gradually decreases.
Eventually, the skydiver's weight is balanced by the air resistance. There is no resultant force and the skydiver reaches terminal velocity.
When the parachute opens, the air resistance increases. The skydiver slows down until a new, lower terminal velocity is reached.
Note that the skydiver does not go upwards when the parachute opens, even though this can appear to happen when a skydiver is being filmed. The illusion happens because the person with the camera opens their parachute later on, so falls downwards past the skydiver.
Quiz
Test your knowledge with this quiz on describing motion.
Teaching resources
Are you a physics teacher looking for more resources? Share these short videos with your students, in which Brian Cox introduces the speed equation and explains the importance of always using common sense and checking that any mathematical answers seem reasonable:
More on Motion, forces and energy
Find out more by working through a topic
- count3 of 11
- count4 of 11
- count5 of 11
- count6 of 11