What are complex images?
Complex images are graphs, charts, maps, or infographics that convey detailed factual information. They're also known as data visualisations or visual data journalism. They are increasingly used to convey complex data in an easy, visual way.
It's crucial that screen reader users are not excluded from these vital pieces of information.
The text description must provide all the information available to a sighted reader. If the information conveyed is also given within the piece, a less detailed text description is acceptable.
If it is not possible to give all the information in a text description, the information must be given in the wider body of the piece. For example, write about the image content as part of the article, or present a chart in an alternative format, such as a bulleted list or an HTML table.
Designers creating complex images must also create a suggested text description to go with their data visualisations and send this along with their data vis to those who will use it.
Examples
Charts

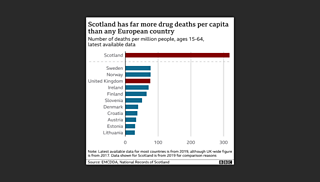
Original text description: "Graph showing drug death rates across Europe."
Recommended text description: "A bar chart showing the numbers of drug deaths in some European countries. Scotland is much higher than any other country, with more than 300 deaths per million people. Then countries range from Sweden, at about 80, down to Lithuania at about 30. The whole of the UK is just below Sweden and Norway, at about 75."
The note and source contained in the image is also important information. They must be made available in an equally accessible way 鈥� either in the caption or in the body of the piece.
Illustrative maps
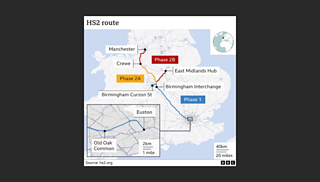
Source: HS2 line between Birmingham and Crewe delayed by two years

Original text description: "Map showing route of HS2 rail line."
This would work if the route of the proposed rail line was discussed within the piece; but as it's not, we need to reconsider how the text description could be written.
Recommended text description: "Map showing the route of HS2. Phase 1 is marked with a blue line going north-west from London to Birmingham. Phase 2A, in yellow, continues in roughly the same direction between Birmingham and Crewe, while Phase 2B, in red, continues north from Crewe to Manchester. There is also a Phase 2B from Birmingham to the East Midlands Hub."
This level of detail is needed as the route of the proposed rail line is not discussed within the piece.
Ideally, the detail given in the map must also be available in the piece so the text description can be shorter.
Infographics
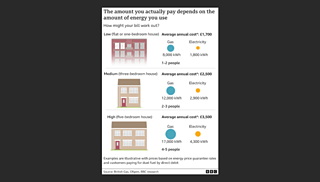
Source: Energy price guarantee: What help is there for gas and electricity bills?

Original text description: "Chart showing illustrative examples of bills based on low, medium, and high energy users."
Recommended text description: "拢1,750 for low usage (1 to 2 people in a flat or one-bedroom house, using 8,000kWh of Gas and 1800kWh electricity). 拢2,500 for medium usage (2 to 3 people in a three-bedroom house, using 12,000kWh of Gas and 2,900kWh electricity). 拢3,500 for high usage (4 to 5 people in a five-bedroom house, using 17,000kWh of Gas and 4,300 kWh electricity). Prices are based on energy price guarantee rates and customers paying for dual fuel by Direct Debit."
Ideally, this is extremely long, so consider an alternative way of conveying the information e.g. within the body of the story or presented in an alternative format like an HTML table.

